







Your 2027 planning spreadsheet is probably open in another tab right now. Last year's spend sits in one column, someone above you has named a growth target, and the Google Ads line is last year's number with a percentage bolted on. It looks tidy. It tells you almost nothing about how many leads that budget buys.
A Google Ads forecast 2027 model that survives contact with January is built from the bottom up: what a lead is worth, what a sale is worth, what you can afford to pay for each, and how much search demand exists at that price. Here's how I'd build it, and where the arithmetic usually breaks.
Audit 2026 Data Across Google and Microsoft Advertising
Conversion tracking is the first thing I check and the most common thing that's wrong. A form submission, a tracked phone call and a CRM import can all record the same enquiry, so the Conversions column shows three leads where the business took one. Forecast from that number and your cost per lead looks a third of what it really is.
Open the conversion actions list before anything else. Confirm which actions are set to Primary, because that selection defines what Smart Bidding optimises towards and what your reports count. If a "newsletter signup" is primary alongside "request a quote", your Target CPA is chasing two very different outcomes at one price.
| Input | Where to pull it | Check before you forecast |
|---|---|---|
| Conversion tracking | Conversions column and selected conversion actions | Each lead or sale counted once, with the right action selected |
| Conversion rate | Clicks to leads in Google Ads, matched to the CRM | Use the last 90 days and exclude months with tracking breaks |
| Close rate and customer value | CRM pipeline and order records | Value per customer split by product or service line |
| Seasonality | Monthly share of leads or sales for 2026 and 2025 | Peak and trough months identified and anomalies flagged |
| CPC trend | Google Ads CPC by campaign and month | Like-for-like comparison, so mix changes are not read as price changes |
| Microsoft Advertising results | Separate account report, reconciled to the CRM | Leads not counted in both Google and Microsoft Advertising |
Seasonality and CPC, the two inputs that lie
A flat monthly average hides the shape of the year. Compare the monthly share of leads and sales in 2026 with the same months in 2025. If December carries 14% of annual revenue and your forecast spreads budget evenly, you'll be short in the month that pays for the year. Percentage of total, not raw counts, is the comparison that works.
CPC needs the same discipline. Compare like-for-like campaigns and keywords year on year, because a shift from broad to exact match changes your average CPC without changing the auction. Mix changes read as price changes if you don't segment.
Give Microsoft Advertising its own row
Microsoft Advertising, formerly Bing Ads, reports its own clicks, costs and conversions and serves ads on Bing search results and partner sites. It doesn't belong inside a Google average, and it doesn't belong in the same lead count either. Pull it as a separate line, reconcile its conversions against the CRM, and make sure a single enquiry hasn't been logged by both platforms.
The one rule I'd apply here: if two systems report the same sale, one of them is wrong. Pick the CRM as the referee and treat platform numbers as directional until they agree.
Before you close the audit, write down the anomalies: the fortnight the site was down, the stock gap in March, the tag change in July. A baseline is only useful if you know which months to leave out of it. For accounts running several platforms, a cross-platform measurement framework keeps the reconciliation honest.
Work Back From Sales Target to Clicks and Spend
Once the inputs are clean, the forecast becomes a chain of divisions and one multiplication. Every step uses a number you already own. Nothing here is a growth rate handed down from the market.
Every figure in the example below is illustrative, built from round numbers so you can follow the mechanics and then swap in your own. Say a business wants 1,500 orders at an average of £400, giving a £600,000 sales target.
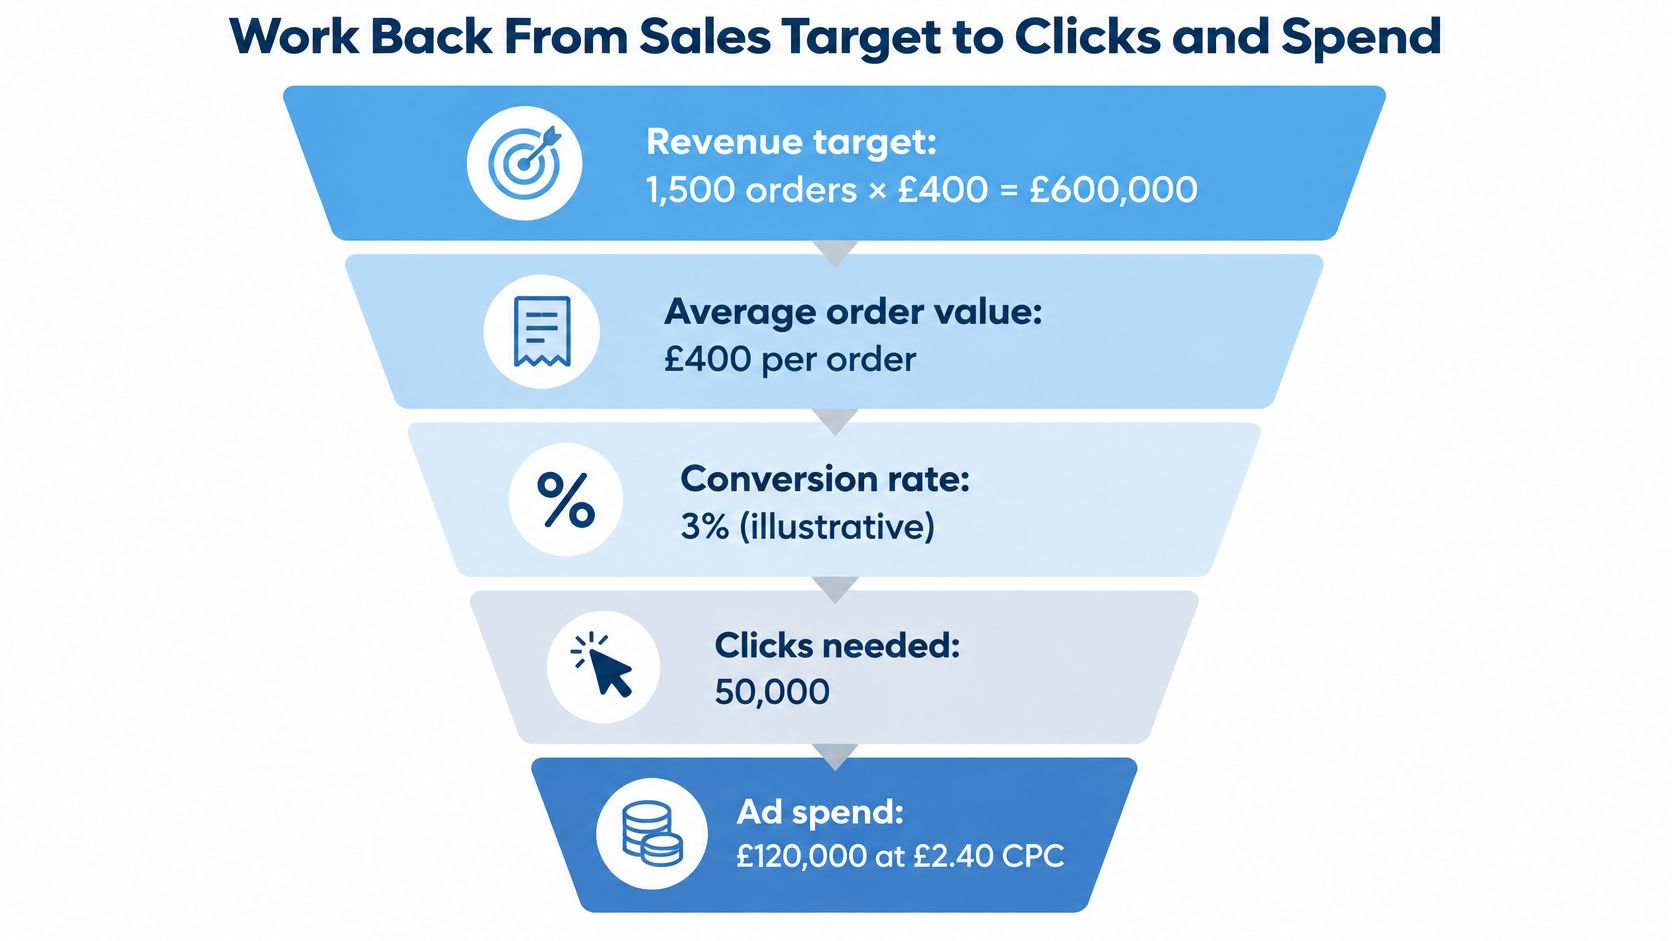
| Step | Calculation | Illustrative value |
|---|---|---|
| Sales target | 1,500 orders × £400 average order value | £600,000 |
| Qualified leads needed | 1,500 orders ÷ 25% close rate | 6,000 leads |
| Clicks needed | 6,000 leads ÷ 4.0% lead conversion rate | 150,000 clicks |
| Media budget | 150,000 clicks × £2.10 average CPC | £315,000 |
| Cost per lead | £315,000 ÷ 6,000 leads | £52.50 |
| Cost per sale | £315,000 ÷ 1,500 orders | £210 |
| ROAS | £600,000 ÷ £315,000 × 100 | 190% |
The close rate is the step most forecasts skip. Google reports leads; your sales team converts them. If 25% of qualified leads become orders, you need four leads for every sale, and the cost per sale is four times the cost per lead. That gap is where budgets get approved on fantasy numbers.
Google's own definition is worth keeping in front of you: target ROAS is the average conversion value you want for each unit of spend, calculated as conversion value divided by cost, multiplied by 100. Google also recommends using historical ROAS as a reference point rather than inventing a figure. Where lead quality varies by location, device or audience, conversion value rules can multiply values within a range of 0.5 to 10, so a forecast can reflect commercially different outcomes instead of treating every enquiry as equal.
The method you repeat for every product line
Four moves, in this order. Set the revenue goal for that line. Divide down to leads and clicks using verified close and conversion rates. Multiply clicks by the CPC from your own account. Then test the resulting cost per sale against the margin that line earns.
Do it once for the blended business and again per service line, because a 190% blended ROAS can hide one range running at 320% and another at 95%. A PPC budget calculator is a useful way to sanity-check the sums, but the inputs still have to come from your CRM and your account.
Forecast Efficiency Before Volume
Most 2027 plans run in the wrong direction. They start with a budget, apply a growth percentage, and assume efficiency holds. Budget is the easiest variable to change and the last one that should move. The accounts that grow profitably work the other way round: fix the efficiency line first, then buy volume against it.
Fixing efficiency first is unglamorous work. It means conversion values that reflect what a sale is actually worth, a Shopping feed with no gaps in the attributes Google matches on, creative that gets replaced before it fatigues, and tracking that reports revenue rather than flattering it. Automation amplifies whatever it is fed. Give Performance Max and Smart Bidding clean inputs and they spread spend across the products and queries that pay; give them inflated values or a stale feed and the same systems scale the waste just as efficiently.
None of that requires a bigger budget. It requires decisions made before the budget arrives.
What the market forecast does and doesn't tell you
The Advertising Association and WARC forecast puts the UK advertising market at £54.7 billion in 2027, up 6.5% year on year, with search advertising expected to grow 6.6% after 9.3% in the preceding period, and social media and retail media projected at 13.3% and 13.0% respectively.
Read that correctly. A growing search market means demand for efficient keyword targeting, Shopping optimisation and sensible budget allocation stays strong through 2027. But a 6.6% category growth rate is not a promise of cheaper clicks, and it is certainly not your account's growth rate. In our Q2 2026 CPC analysis, like-for-like CPCs across the same 53 UK accounts rose only about 4% year on year between Q2 2025 and Q2 2026. That is the figure I'd carry into a 2027 plan unless the account's own trend says otherwise.
A forecast that assumes 2027 efficiency beats 2026 by default is a hope, not a plan. If the account trend is flat, forecast flat, and treat any gain from the input work above as headroom rather than as a number already banked.
The sequence that works: set the efficiency target, hold it for a full quarter, then add budget in steps and confirm the returns survive each step. If ROAS sags after the second increase, you've found the ceiling, and it's cheaper to find it in April than in November.
Set CPA and ROAS Targets That Hold Up
Start with break-even, not with last year's best month. Assume an illustrative 60% gross margin: a £400 sale yields £240 of margin. If a qualified lead closes at 25%, that lead is worth £60 in margin, so £60 is your CPA ceiling. The matching break-even ROAS is 167%, because 100 divided by 60 gives 1.67.
Against that ceiling, the worked example's £52.50 cost per lead and 190% ROAS sit comfortably inside the line. That's the test to run on every target before it goes into a plan. Not "is this better than last year" but "does this still make money if it lands exactly here".
Google grounds a Target CPA in evidence rather than benchmark tables. Where historical conversion data exists, the recommended Target CPA is based on the average CPA from the previous 30 days, adjusted for conversion delays, and the bid strategy then treats that figure as an average cost per conversion, adjusting bids by how likely each auction is to convert. Which is why the order matters: verified 2026 CPA by campaign and conversion action first, then explicit assumptions for lead-to-sale rate, sales capacity and seasonality on top.
For a large travel operator, the fix was structural. We rebuilt campaigns around purchase-based conversions and changed the bid strategy to prioritise downstream revenue, so the target reflected booked value rather than form fills. The target became defensible because the conversion it optimised towards was the one the finance team cared about.
Three target types, three failure modes
| Target | How to set it | Best used when | Main risk |
|---|---|---|---|
| Target CPA | Start from the recent average CPA adjusted for conversion delay, then test it against the margin ceiling | Lead generation with stable lead values | Set too low, which cuts volume |
| Target ROAS | Start from historical ROAS, then set it from margin headroom using conversion value ÷ cost × 100 | Ecommerce or variable order values | Anchored on last year's best month |
| Manual bidding | Fixed bids set from the break-even CPC | Very low conversion volume that cannot support automation | Less efficient as spend scales |
Two rules I'd hold to: set the first target at the expected case, never the best case. And where order values vary, build the ROAS target from margin headroom rather than a single headline average, or a handful of large orders will flatter a target the rest of the catalogue can't hit.
If you want the reporting that makes these targets readable, the guide to campaign performance metrics covers which numbers belong in front of the budget holder.
Build Best, Expected and Worst Case Scenarios
One forecast number is a guess wearing a suit. Three bands show the range you'd defend in a planning meeting. Start from the break-even ROAS and CPA ceiling set by margin, then hold clicks at 150,000 in every case so only price and conversion rate move.
| Scenario | CPC and lead conversion rate | Leads | Spend | Cost per lead | ROAS |
|---|---|---|---|---|---|
| Best | £1.95 CPC, 4.5% conversion | 6,750 | £292,500 | £43.33 | 231% |
| Expected | £2.10 CPC, 4.0% conversion | 6,000 | £315,000 | £52.50 | 190% |
| Worst | £2.31 CPC, 3.4% conversion | 5,100 | £346,500 | £67.94 | 147% |
ROAS in that table assumes the 25% close rate and £400 sale value, and spend is clicks multiplied by CPC. The best case is a 7% CPC improvement with a half-point conversion gain. The expected case is the planning line. The worst case is a 10% CPC rise with a 0.6-point conversion loss, and that downside is realistic rather than remote: in PPC Geeks' Q2 2026 CPC analysis, like-for-like CPCs across the same 53 UK accounts rose only about 4% year-on-year, from Q2 2025 to Q2 2026. Stress-testing non-brand campaigns against a meaningful CPC rise is sensible, because rising auction demand can lift costs even while search growth moderates. If a 2027 sales target needs more than 150,000 clicks, price it as a separate case rather than letting the expected band absorb it.
Split brand from non-brand before you trust the bands
Branded demand rarely moves like generic search. Someone searching your company name has usually already decided, so brand clicks arrive cheaper and convert better. Blend the two and brand performance will mask a non-brand problem that has been getting worse all year.
Run separate bands. Brand usually needs a low CPC assumption and a high conversion rate. Non-brand carries the stress test, and it is where £2.31 CPC starts to break the budget.
Read the worst case against the break-even line
The worst case still produces 5,100 leads, which is why a meeting can talk itself into continuing. Volume keeps arriving while margin leaks: ROAS is 147%, below the 167% break-even derived from margin, and cost per lead is £67.94 against a £60 ceiling.
Set the trigger now, in writing. Pause budget growth if CPC passes £2.31 or conversion rate drops below 3.4%. Tie any increase to marginal economics: additional spend has to keep marginal cost per acquisition at or below £60 and marginal ROAS at or above 167%. A growing market does not prove your next £10,000 earns its keep.
Review the Forecast Every Quarter
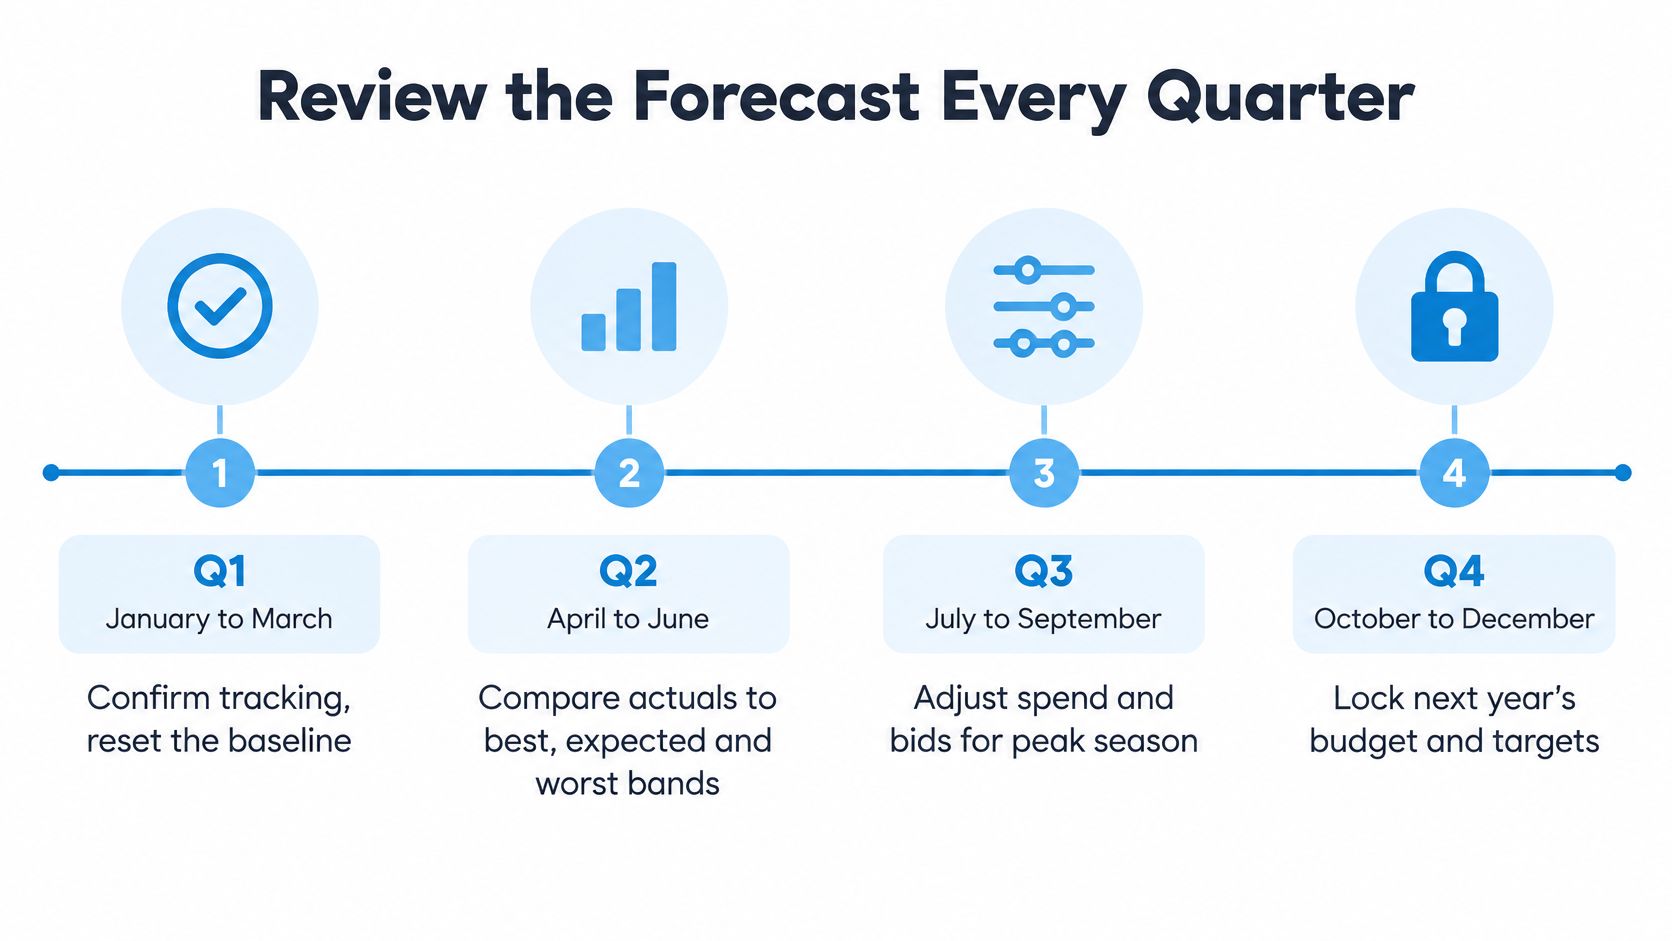
A forecast is a working document, not a signed contract. Four reviews a year, each with a fixed job, keeps it honest without letting anyone panic-edit targets every Monday.
- Q1, January to March: confirm tracking survived the year boundary, reset the baseline with Q4 actuals, and check conversion delay hasn't shifted. December often reports late, so this is the quarter to catch it.
- Q2, April to June: compare actual cost per lead, conversion rate, CPC and ROAS with the expected band. If results sit inside it, change nothing. That's the whole instruction.
- Q3, July to September: check the peak-season plan and CPC movement against the worst-case band. This is when you decide whether to fund the autumn push or hold.
- Q4, October to December: review the year, rebuild the seasonality curve from actuals, and set next year's bands while the data is fresh.
The volume thresholds that stop overreaction
Small samples produce big opinions. Google's Smart Bidding guidance gives concrete guardrails: evaluate performance over longer periods containing at least 30 conversions, such as a month or longer, and note that Target ROAS commonly needs around 50 conversions for a reliable read. For Search and Shopping Target ROAS campaigns, Google specifies at least 15 conversions in the previous 30 days before the strategy applies.
Those aren't profitability guarantees. They're sample-size checks, and they're the reason a bad week isn't evidence of anything. Account for conversion delay before judging a quarter, and confirm the conversion actions still represent genuine leads or sales, because a tracking change in month two rewrites every comparison that follows.
Hold the line on this: change a target only when the review period carries at least 30 conversions. Cut budget only when ROAS sits below the worst-case band across a full review that clears the same threshold. Everything else is noise with a dashboard.
Fix Tracking and Lock Your 2027 Budget
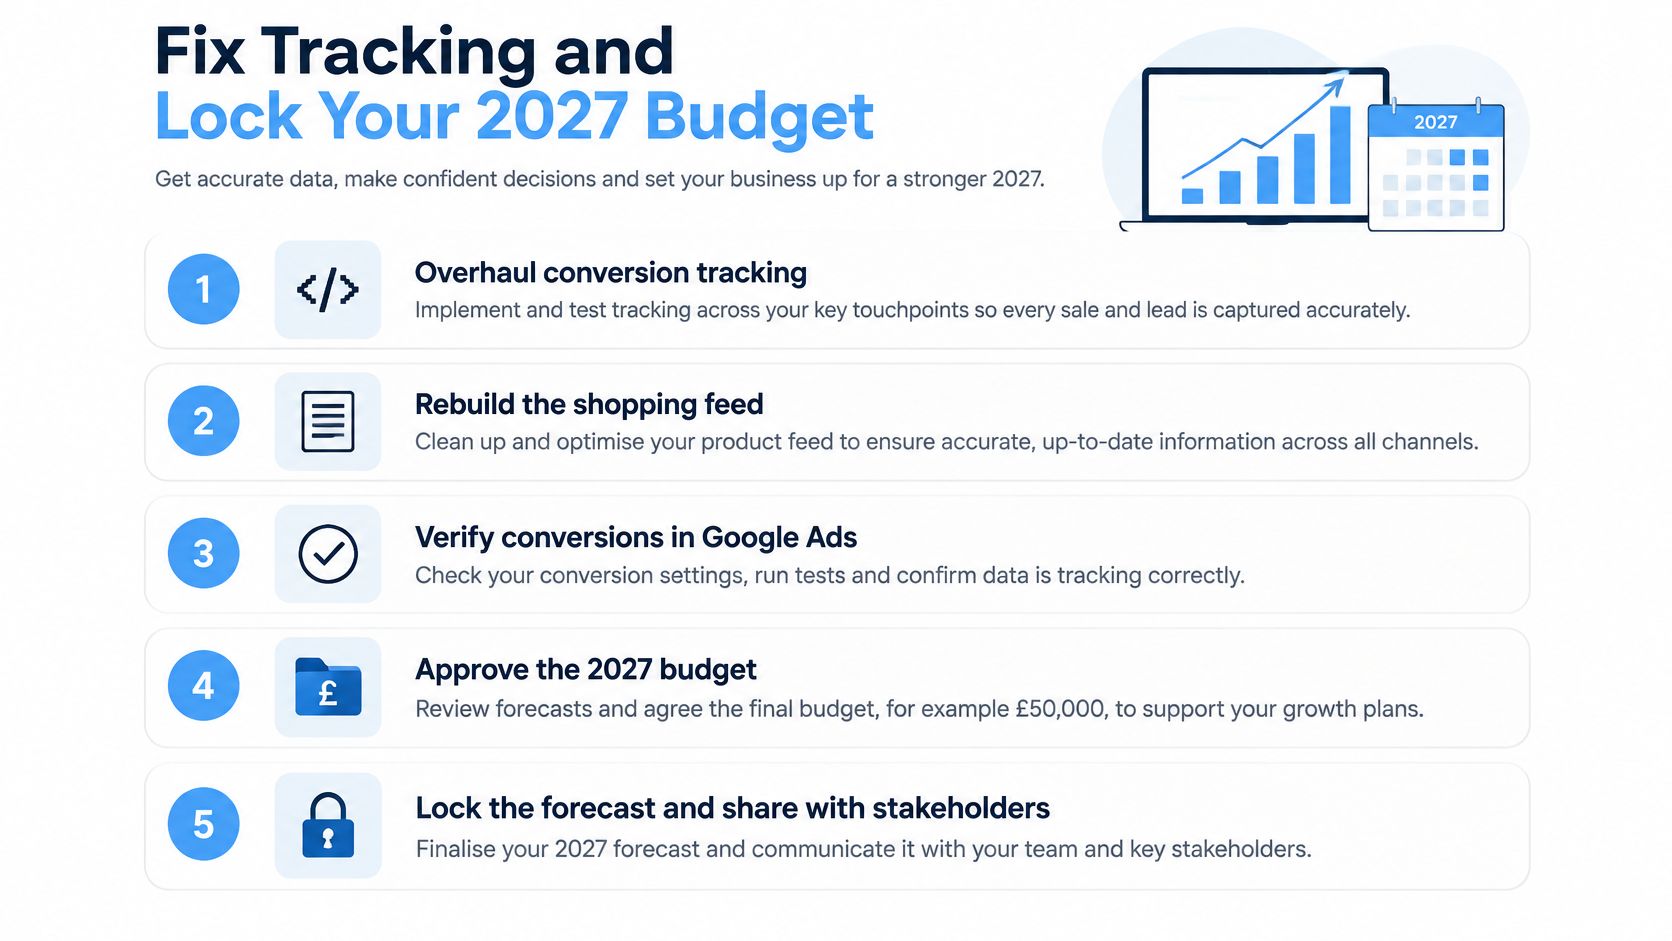
Tracking comes before budget approval, not after it. If the conversion data is wrong, every number downstream of it is wrong in the same direction, and nobody notices until the sales team asks where the leads went.
Tracking and shopping-feed fixes come before any scaling conversation, whatever the account looks like. You cannot forecast from a baseline you don't trust, and you can't optimise a feed that misrepresents the catalogue. A Primary action that double-counts form fills inflates your conversion rate, and that inflated rate flows straight into every click, spend and revenue number the forecast produces.
The sign-off checklist
- Confirm each conversion action counts one real lead or sale, with the correct action set to Primary.
- Rebuild the working-back chain using verified 2026 close rates, conversion rates and customer values.
- Set the CPA ceiling and break-even ROAS from margin before any growth target is discussed, so every 2027 sales goal gets tested against what a lead can afford.
- Record the best, expected and worst bands plus the stop trigger that ends budget growth.
- Book the four quarterly reviews in the calendar now, with the conversion thresholds attached.
If tracking is the weak link, the walkthrough on how to track conversions covers the setup in the order it needs doing. And if you'd rather have a second pair of eyes before the budget is signed off, a Google Ads audit and strategy review looks for wasted spend, tracking and attribution gaps, and the cases where automation or account structure makes performance look cleaner than it is. The free audit request form asks for the website the ads point at, the platform to audit, and your current monthly spend or planned budget, which is usually enough to see whether the 2026 baseline is worth forecasting from.
If your 2027 plan is going to hold up in front of a finance director, it needs a baseline you trust and a break-even line you can defend. Start with a free Google Ads audit at PPC Geeks: it checks tracking, wasted spend and attribution before the budget is signed off, and it will tell you whether your tracking is ready to forecast from, or whether fixing it is the job that comes first.